Section divider

Complete Guide To Selenium Test Automation & Reporting

By Dennis Gurock
16 min read
Complete Guide To Selenium Test Automation & Reporting

Selenium is one of the most popular open source tools to automate web browsers. Its primary use case is running automated tests against web applications and websites to ensure that everything is working as expected. In this guide we will look at the details of setting up a basic test automation project with Selenium and integrating full Selenium reporting with metrics and testing dashboards. This guide will cover the following topics:

Whether you are completely new to Selenium, or want to learn how it integrates with test automation, or you want to benefit from Selenium reporting: we will go through all the details to get this up and running, so let's get started!

Test automation & Selenium reporting with Testmo

1. Quickstart: Basic Selenium Concepts

If you are new to Selenium, it can be a bit overwhelming to understand all the involved bits and pieces and how it all works together. Especially because the different tools and components have similar names. Things are fortunately much easier than they sound and lets start by looking at the basic concepts of Selenium and how it interacts with web browsers:

  • Automation script: It all starts with your automation script. To automate a browser and develop automated tests with Selenium, you start by writing a script in a programming language of your choice. The language you use doesn't really matter: you can use Selenium with most popular programming languages such as Java, Python, Ruby, C#, PHP, JavaScript etc. We recommend using the programming language you are already familiar with. For our article we are going to write our examples in JavaScript (Node.js), but any language will work.
  • Selenium WebDriver: This is the library (binding) you use with your programming language. It provides various APIs to drive and automate a web browser, such as navigating to a page, clicking buttons, entering text into fields, checking for visible text etc. This is what most people understand as the core Selenium component they use on a daily basis.
  • Browser driver (ChromeDriver, GeckoDriver etc.): This is where things get a bit confusing, because the names all sound similar. The above mentioned Selenium WebDriver library uses a specific protocol (also called WebDriver) to talk to browsers. The library doesn't talk to the browser directly though. Instead, browser vendors provide a small driver application to connect to. The driver application then actually implements the browser automation.

    The drivers are named differently for different browsers. For example, Google calls their driver application for Chrome ChromeDriver. For Firefox, Mozilla provides an application called GeckoDriver. Then there's SafariDriver from Apple, EdgeDriver from Microsoft etc. The important thing you need to know is that you need to run the relevant driver for your browser if you want to automate it (we will look at this below).

What about other components such as Selenium Grid? Don't worry about this for now, we will look at this later.

For now we will start with our automation script. It will use the Selenium WebDriver binding library for the programming language we've selected. This in turn will connect to the relevant browser driver we want to automate, which drives the browser. This is all we need to understand to get started for now and the following illustration shows how these basic components work together.

Basic Selenium components and how everything fits together

2. Setting Up Selenium Environment

There are different options to get started with Selenium development and to set up the local development environment. You could install and run all the required tools and packages directly on your main machine. It would be quite time consuming to do this though and it would be cumbersome to keep all the versions updated and in sync all the time. It would also be nice if we had an isolated environment to run our code, so it wouldn't affect our main machine if we made a mistake.

So instead we are going to run everything inside Docker containers. Using Docker containers for our local development environment has many advantages. It makes it much easier to try different packages and projects (as we can simply use a pre-configured Docker image). We can start and stop services as needed to save resources. And all our code runs isolated from our main machine. If you don't use Docker already, make sure to install and get familiar with it to follow this article.

For this project we are creating a new Git repository named example-selenium-test-automation-reporting to store our files. You can also find the full repository on GitHub, so you can always review the project files there. To start with our development environment, we are going to use a Docker Compose config that provides two services. Here is our config file that is stored in the dev directory of our project:

# dev/docker-compose.yml
version: '3'
services:
  selenium:
    image: selenium/standalone-chrome
    ports:
      - 4444:4444 # Selenium service
      - 5900:5900 # VNC server
      - 7900:7900 # VNC browser client
  node:
    image: node:19
    volumes:
      - ./../:/project
    working_dir: /project

First, we will use the official selenium/standalone-chrome image to run Google Chrome for Selenium inside Docker. This Docker image also comes with (and hosts) the ChromeDriver browser driver. So when this container starts, our script can connect to port 4444 to request a new Chrome session and drive the browser.

The second service we will define here, namely node, will be our development container. We will use this container to develop and run our tests locally, so we don't have to run any of our test code on our main machine. We are using the official node image for this, which hosts the Node.js (JavaScript) runtime that we will be using for our JavaScript automation script. If you use a different programming language for your code, you would use a different Docker image here.

We can use Docker Compose to start our Selenium Chrome container now. Once this service is running (in the background), we use our node image to launch an interactive shell. Inside this container we can now develop and run our code and it can connect to the Selenium service to launch and drive a Chrome instance.

# First start the Selenium browser container
$ docker compose up -d selenium
Creating network "dev_default" with the default driver
Creating dev_selenium_1 ... done

# Then launch a shell inside our dev container
$ docker compose run node bash
root@c4bb97a4249f:/project$ node -v # Inside our container
v19

Now that the services are running, how can we see what happens inside the container and what our browser looks like once we run our automation script? This is where things get fun! Noticed the additional ports we mapped in our docker-compose.yml config? The official Selenium Docker image hosts a VNC server, so we can connect to it and see the browser through screen sharing.

You can use a VNC client to connect to it, such as the built-in VNC client for macOS or one of the various third-party clients for Windows (just connect to localhost:5900). Or you can point your web browser to http://localhost:7900/, which launches a browser-based VNC client hosted by the Selenium container. In both cases, just enter the default password secret. When we automate Chrome through Selenium (see below), we can now watch and follow all browser interactions live. Pretty cool!

Watching the browser activity inside the Selenium container via VNC

Start Testing with Testmo Free

#1 Unified Test Management + Selenium Integration

Test automation runs
Test automation command line

3. Our First Selenium Browser Script

Now we are ready to write our first automation script to launch and drive Chrome. We are using Node.js (JavaScript) for our automation script, so we will start by installing the required Selenium binding for JavaScript. The easiest way to do this is to use the NPM package manager (remember to run this inside the development container):

# Run this inside the dev container
$ npm install --save-dev selenium-webdriver

This will install the official selenium-webdriver package for JavaScript and also write the project dependencies to the package.json and package-lock.json files. These files make it easy to install our project dependencies at any time again in the future (e.g. if we cleared our project directory). Make sure to commit these files to your project repository as well.

Let's start with a very basic automation script. Copy the following content and save it as a file called automation.mjs in your project directory (note the .mjs extension, not just .js, as this will enable the modern ES6 version):

// automate.mjs
import { Builder, By, Key, until } from 'selenium-webdriver';

// We connect to our 'selenium' service
const server = 'http://selenium:4444';

// Set up a new browser session and launch Chrome
let driver = await new Builder()
    .usingServer(server)
    .forBrowser('chrome')
    .build();

try {
    // Automate DuckDuckGo search
    await driver.get('https://duckduckgo.com/');

    // Search for 'Selenium dev'
    const searchBox = await driver.findElement(By.id('search_form_input_homepage'));
    await searchBox.sendKeys('Selenium dev', Key.ENTER);

    // Wait until the result page is loaded
    await driver.wait(until.elementLocated(By.id('links')));
} finally {
    // Close the browser
    await driver.quit();
}

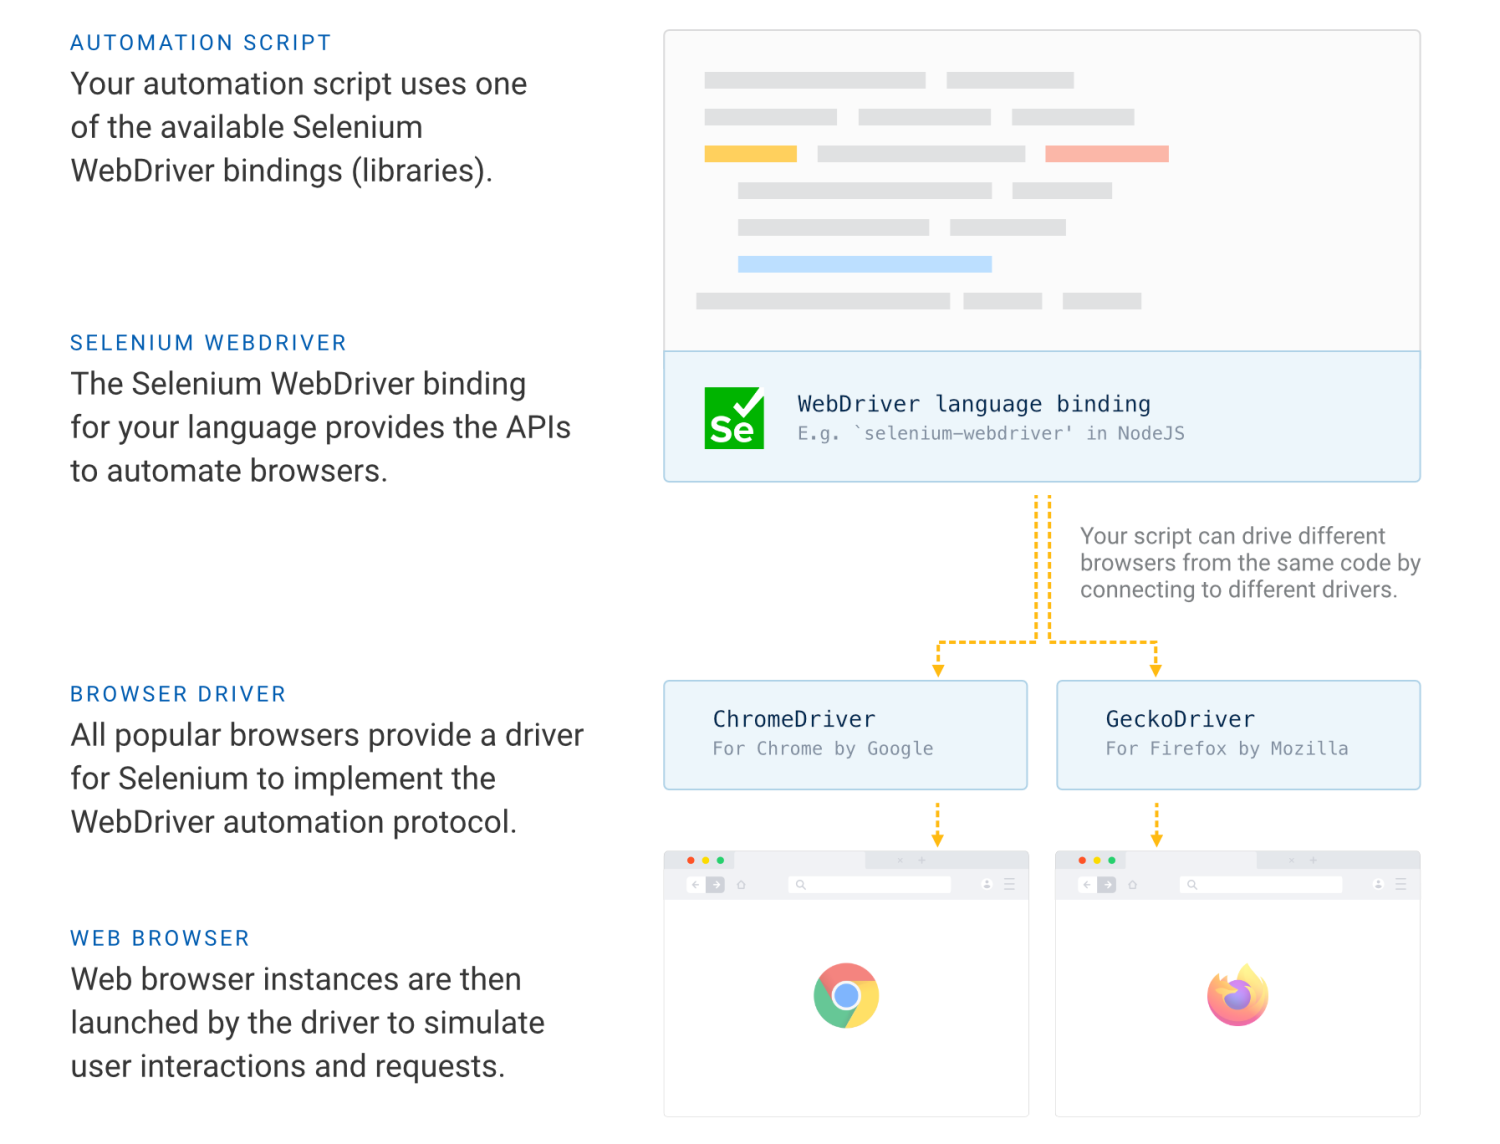
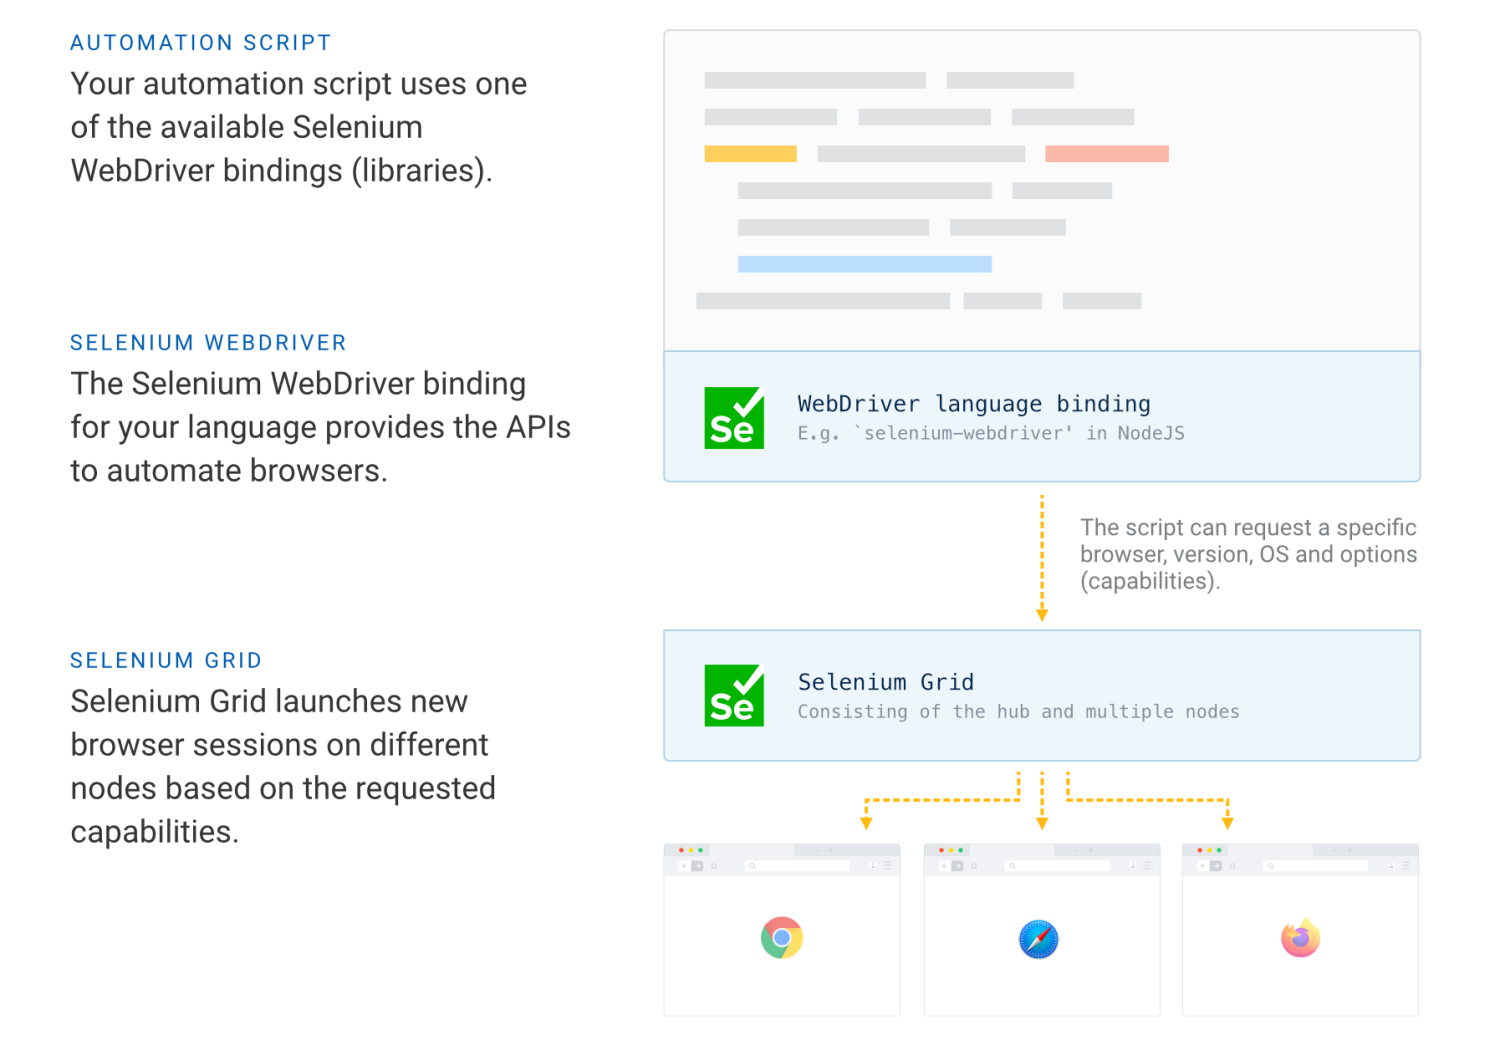
Let's review the important bits of our first script step by step. We start by importing the relevant exports of the selenium-webdriver package first (line 2). We then connect to the service provided by the selenium docker container and request a new web browser session and launch a Chrome instance inside the container (lines 4-11). We need to specify the browser name here ('chrome'), as Selenium can also connect to services that support multiple browsers and different versions (we will look at this later).

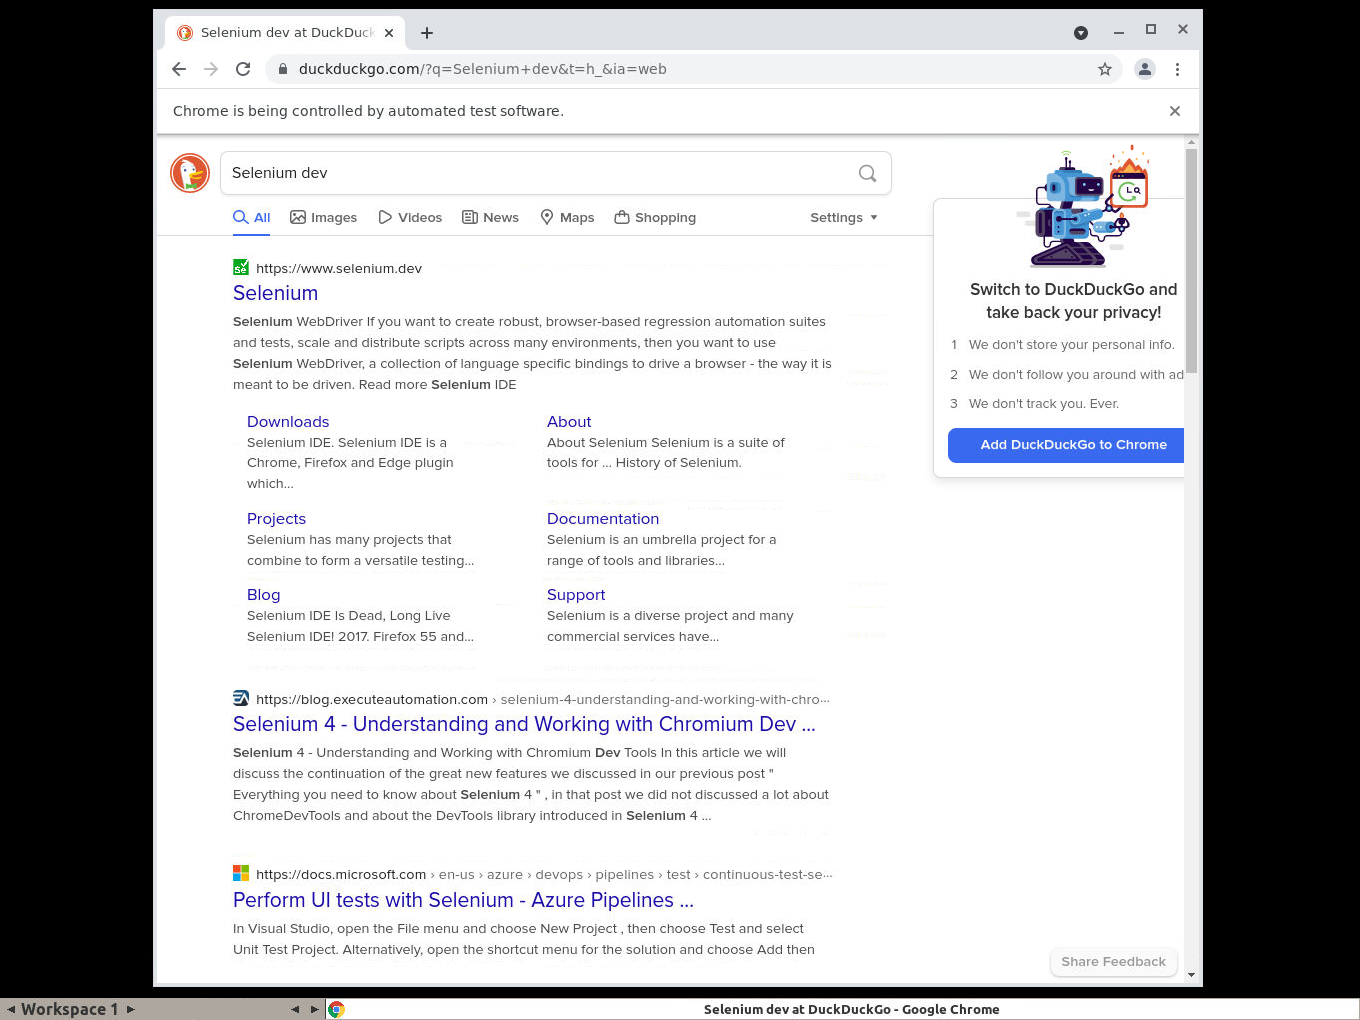
Our automation script tells the browser driver to open the DuckDuckGo search website (line 15). By default, Selenium will wait for the page to fully load before continuing. So after the call to load the page, we find the search input field on the page, enter the search string Selenium dev, and instruct Selenium to simulate pressing the Enter key to submit the search form (lines 18-19). There are various ways to find elements on a page and interact with them, e.g. via the the ID, element name, CSS class, path etc. The Selenium documentation provides a good overview of supported methods:

After we submitted the search, we also need to wait for the result. If we just submitted the search form, the script might finish before we received the result, because Selenium (or the browser) wouldn't know what to wait for. So we need to find a way to wait for the search result. In our case we are waiting for an element on the result page with the ID links, as DuckDuckGo renders this element as part of the search results. So we use the driver.wait call to wait for the element on the page to be rendered as part of the search result (line 22). Selenium offers various ways to wait for elements and other changes on the page, and you can also write custom wait logic:

Last but not least we end the browser session by calling driver.quit (line 25). This is important to avoid leaving an incomplete browser session running in the container, which would prevent us from starting another one before it times out. It's a good idea to wrap it in try .. finally to ensure that the script always closes the browser, even if there was an error in our script.

We can simply start the script inside our container by using the node (Node.js JavaScript runtime) command. Make sure to connect to the VNC service (see above) so you can see the browser in action:

# Running our script inside the dev container
$ node automate.mjs

4. Using Selenium With Test Automation

Our automation script launches a Chrome browser instance and starts a web search. But it doesn't really test anything. To write a test automation suite with Selenium, we will use a test automation framework to write some actual tests. For JavaScript there are different options available to write test suites, and we will use the popular Mocha/Chai framework combination. So inside our development container we install and add these dependencies by using the NPM package manager again:

# Run this inside the dev container
$ npm install --save-dev mocha chai mocha-junit-reporter

This will write the new dependencies to our package.json and package-lock.json files, which you need to commit to the repository again. For our test suite we will be doing multiple web searches (one search per test case) and verify the search by checking the search result page for specific URLs (assertions). For now we will create the basic test suite and add a file named test.mjs with the following content (note the .mjs extension again):

// test.mjs
import { assert } from 'chai';

describe('search', async function () {
    // Our test definitions
    it('should search for "Selenium dev"', async function () {
        assert.isTrue(true);
    });

    it('should search for "Appium"', async function () {
        assert.isTrue(true);
    });

    it('should search for "Mozilla"', async function () {
        assert.isTrue(true);
    });

    it('should search for "GitHub"', async function () {
        assert.isTrue(true);
    });

    it('should search for "GitLab"', async function () {
        assert.isTrue(true);
    });
});

To make it easier to start our test automation suite, we are also going to add a couple of script aliases to our package.json file. With these script aliases we don't have to remember various longer command lines and we can just use npm run to run these aliases. You can find the full package config file in the GitHub repository. Once you've updated the package.json file with the additional script aliases, we can run our test automation suite like this:

# Run our tests inside the dev container
$ npm run test

> test
> npx mocha test.mjs

  search
    ✔ should search for "Selenium dev"
    ✔ should search for "Appium"
    ✔ should search for "Mozilla"
    ✔ should search for "GitHub"
    ✔ should search for "GitLab"

  5 passing (7ms)

Next we are going to add our actual Selenium browser tests to the test suite. For each test case we want to start a new browser session and then close the browser after each test. This way, each test case always starts with a clean new browser instance (with no previous cookies etc.), making the tests more reproducible and predictable. Mocha provides useful beforeEach and afterEach functions that we can implement:

// Before each test, initialize Selenium and launch Chrome
beforeEach(async function() {
    const server = 'http://selenium:4444';
    driver = await new Builder()
        .usingServer(server)
        .forBrowser('chrome')
        .build();
});

// After each test, close the browser
afterEach(async function () {
    if (driver) {
        // Close the browser
        await driver.quit();
    }
});

We want to search for a specific term and check (assert) the result page content in each test case. So we don't have to repeat our code in each test, we are writing a small helper function that starts the browser search, waits for the result page and then returns the page content to the test. Here's our helper function that implements this:

// A helper function to start a web search
const search = async (term) => {
    // Automate DuckDuckGo search
    await driver.get('https://duckduckgo.com/');
    const searchBox = await driver.findElement(
        By.id('search_form_input_homepage'));
    await searchBox.sendKeys(term, Key.ENTER);

    // Wait until the result page is loaded
    await driver.wait(until.elementLocated(By.id('links')));

    // Return page content
    const body = await driver.findElement(By.tagName('body'));
    return await body.getText();
};

Finally we update our test cases to search for different terms and verify that the resulting page content contains the web addresses we want to check for. Each test case uses our new search function to start the search. We then use the assert.isTrue function to tell our testing framework if the test passes or fails.

// Our test definitons
it('should search for "Selenium dev"', async function () {
    const content = await search('Selenium dev');
    assert.isTrue(content.includes('www.selenium.dev'));
});

it('should search for "Appium"', async function () {
    const content = await search('Appium');
    assert.isTrue(content.includes('appium.io'));
});

it('should search for "Mozilla"', async function () {
    const content = await search('Mozilla');
    assert.isTrue(content.includes('mozilla.org'));
});

it('should search for "GitHub"', async function () {
    const content = await search('GitHub');
    assert.isTrue(content.includes('github.com'));
});

it('should search for "GitLab"', async function () {
    const content = await search('GitLab');
    assert.isTrue(content.includes('gitlab.com'));
});

When you then run the tests with the npm run test command again, Mocha will execute one test case after the other, which will launch a new Chrome browser session and search DuckDuckGo. Each test will verify that the web address we want to check for exists on the result page. Once all tests have been run, Mocha will print the test results to the console for us to review.

To make the test suite even more useful, we can also take screenshots at the end of each test. For this we are adding new code to the afterEach function to take a screenshot of the browser window and save the file to the screenshots sub directory. You can see the full test.mjs script and our new screenshot code in the repository on GitHub.

5. Reporting Selenium Test Results

Submitting and reporting our Selenium test results to a test management tool such as Testmo allows us to track test runs over time, share test results with our team, identify problematic test cases (such as slow or flaky tests) and improve our test suite. It also allows us to manage our automated tests together with other testing efforts such as manual test case management or exploratory testing sessions. To report our test results to Testmo, we start by installing the Testmo command line tool. We will again use the NPM package manager for this and commit the updated package config files to our repository:

# Run this inside the dev container
npm install --save-dev @testmo/testmo-cli

So far, our test automation suite prints all test results to the console. To submit our test results to a testing tool, we need a better and more structured way to save our results. Over the time the JUnit XML file format has become the de facto standard to store and share test automation results. So we will tell Mocha to write our results to such an XML file. Pretty much any test automation tool or framework supports this file format directly or indirectly, so this approach will work with any tool.

When we previously updated our package.json file with additional script aliases, we also added a script called test-junit, which calls Mocha with additional parameters to generate such a file. If you run this script (npm run test-junit) you can find the newly created result file in the results sub directory.

We can then use the testmo command line tool to upload the results from this file and create a new test run. We just set the Testmo URL and API key first (which can be generated from the user profile page in Testmo) and specify additional parameters such as the project ID, new test run name, etc.

# Set Testmo address and API token inside the dev container
$ export TESTMO_URL=**************
$ export TESTMO_TOKEN=**************

# Then use the `testmo` tool to create a new test run and submit results
$ npx testmo automation:run:submit \
  --instance "$TESTMO_URL" \
  --project-id 1 \
  --name "Selenium test run" \
  --source "unit-tests" \
  --results results/*.xml

Collecting log files ..
Found 1 result files with a total of 5 tests
Created new automation run (ID: 254)
Created new thread (ID: 608)
Sending tests to Testmo ..
Uploading: [████████████████████████████████████████] 100% | ETA: 0s | 5/5 tests
Successfully sent tests and completed run
Marked the run as completed

After the test run has been created in Testmo and the test results have been submitted, we can see all tests and results by accessing the run in Testmo. The run will list all test details such as execution times, test names, passed and failure statuses, assertions etc. This is what the test results of a run look like in Testmo:

Results of a test automation run displayed in Testmo

We first started our Selenium automation suite by running Mocha (via npm run test-junit), which executed our test cases and wrote the results to an XML file. We then called the testmo command after that to report and submit the results. But there's a slightly better way to do this.

We can call testmo and pass the Mocha test run command as the last parameter instead. The testmo command line tool will then launch our test suite with Mocha itself. This has the added benefit that Testmo can then also capture the full console output of our tests, it can measure the execution time and it can record the exit code (which it also passes through by default). Testmo will then also show all these details along with the test results, so we can see the full console output, for example.

We also added a script alias to our package.json file for this. Simply run npm run test-ci from the command line. This will launch testmo and tell it to run our Mocha tests before uploading the results.

Test run and its console output & execution time in Testmo

6. Introducing Selenium Grid

We've accomplished our goal of creating a sample Selenium test automation suite for this project and then report the results to a QA tool. But no Selenium guide can be complete without also looking at Selenium Grid and explain what it is.

Remember when we discussed how the Selenium WebDriver binding (library) connects to a browser driver application (such as ChromeDriver) to launch and drive a browser? This is what you would often do for a simple local development environment. To run your tests against different browsers, browser versions or operating systems, you would usually connect to a Selenium Grid setup instead. When you then request a specific browser and browser version, Selenium Grid can launch a browser on a separate node that matches the requested details (it also makes it easier to run multiple browsers simultaneously at the same time).

We have actually been using Selenium Grid when we executed our tests for this example project. The selenium/standalone-chrome container image doesn't just run ChromeDriver, it actually provides its services through Selenium Grid (in standalone mode without separate nodes). So when our script connects to selenium:4444, it asked the Selenium Grid instance to launch a Chrome browser session for us.

Setting up a full Selenium Grid cluster with multiple nodes is outside of the scope of this article (and you don't usually need this in many cases). But if you are using a third-party cloud service to run your Selenium tests (see below), remember that you are likely using and connecting to a Selenium Grid setup to launch and drive browsers. Here's what this usually looks like:

Testing against different browsers and versions with Selenium Grid

7. What's Next? CI Pipelines & Cloud Services

There are various additional related topics and concepts that are useful to extend our Selenium test automation & reporting example. In many scenarios when you develop and run automated tests, you also want to execute the tests as part of your CI & build pipelines running on services such as GitHub Actions, GitLabs, CircleCI, Jenkins, Bitbucket etc. This is especially useful for Selenium tests, as it can take a long time to run a large browser automation suite and CI platforms make it easy to run multiple tests in parallel.

We have additional articles on running automated tests with CI pipelines for different platforms, and make sure to subscribe to notifications if you want to learn about upcoming articles featuring the exact Selenium setup for these platforms as well:

If you want to run your Selenium tests against many different browsers and version combinations, or want to run your tests against platforms that are difficult to host yourself (such as macOS or mobile platforms), then it can be useful to use a cloud service for this. You can learn more about using such services with Testmo with our Sauce Labs test management and BrowserStack test management integrations and we will also have more upcoming code examples and articles for these platforms.

Start Testing with Testmo Free

#1 Unified Test Management + Selenium Integration

Test automation runs
Test automation command line

PS: We regularly publish original software testing & QA research, including free guides, reports and news. To receive our next postings, you can subscribe to updates. You can also follow us on Twitter and Linkedin.

Section divider
More from Testmo
Our complete guide to GitHub Actions parallel testing jobs. Improve test automation execution & performance by running parallel testing jobs and speed up your CI pipeline & deployment workflow.
Read full article
We are announcing an update for Testmo and our CLI tool to make it easier to include additional information with automation results such as fields, steps and attachment links.
Read full article
Learn how to configure and set up a modern test automation CI workflow with CircleCI, Docker, test automation reporting and best practices.
Read full article

Start testing with Testmo for free today

Unified modern test management for your team.